Chapter 1 – Sounds and signals
A signal represents a quantity that varies in time. That definition is pretty abstract, so let’s start with a concrete example: sound. Sound is variation in air pressure. A sound signal represents variations in air pressure over time.
A microphone is a device that measures these variations and generates an electrical signal that represents sound. A speaker is a device that takes an electrical signal and produces sound. Microphones and speakers are called transducers because they transduce, or convert, signals from one form to another.
This book is about signal processing, which includes processes for synthesizing, transforming, and analyzing signals. I will focus on sound signals, but the same methods apply to electronic signals, mechanical vibration, and signals in many other domains.
They also apply to signals that vary in space rather than time, like elevation along a hiking trail. And they apply to signals in more than one dimension, like an image, which you can think of as a signal that varies in two-dimensional space. Or a movie, which is a signal that varies in two-dimensional space and time.
But we start with simple one-dimensional sound.
The code for this chapter is in chap01.ipynb, which is in the repository for this book (see Section 0.2).

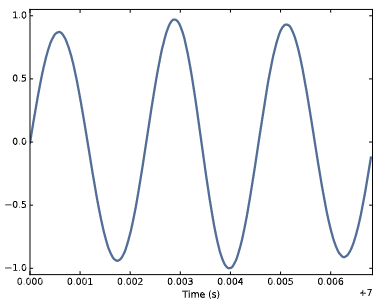
Figure 1.1: Segment from a recording of a bell.
1.1 Periodic signals
We’ll start with periodic signals, which are signals that repeat themselves after some period of time. For example, if you strike a bell, it vibrates and generates sound. If you record that sound and plot the transduced signal, it looks like Figure 1.1.
This signal resembles a sinusoid, which means it has the same shape as the trigonometric sine function.
You can see that this signal is periodic. I chose the duration to show three full repetitions, also known as cycles. The duration of each cycle, called the period, is about 2.3 ms.
The frequency of a signal is the number of cycles per second, which is the inverse of the period. The units of frequency are cycles per second, or Hertz, abbreviated “Hz”. (Strictly speaking, the number of cycles is a dimensionless number, so a Hertz is really a “per second”).
The frequency of this signal is about 439 Hz, slightly lower than 440 Hz, which is the standard tuning pitch for orchestral music. The musical name of this note is A, or more specifically, A4. If you are not familiar with “scientific pitch notation”, the numerical suffix indicates which octave the note is in. A4 is the A above middle C. A5 is one octave higher. See http://en.wikipedia.org/wiki/Scientific_pitch_notation.
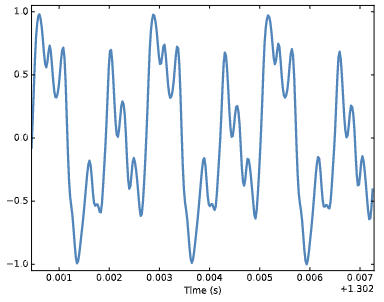
A tuning fork generates a sinusoid because the vibration of the tines is a form of simple harmonic motion. Most musical instruments produce periodic signals, but the shape of these signals is not sinusoidal. For example, Figure 1.2 shows a segment from a recording of a violin playing Boccherini’s String Quintet No. 5 in E, 3rd movement.

Figure 1.2: Segment from a recording of a violin.
Again we can see that the signal is periodic, but the shape of the signal is more complex. The shape of a periodic signal is called the waveform. Most musical instruments produce waveforms more complex than a sinusoid. The shape of the waveform determines the musical timbre, which is our perception of the quality of the sound. People usually perceive complex waveforms as rich, warm and more interesting than sinusoids.


