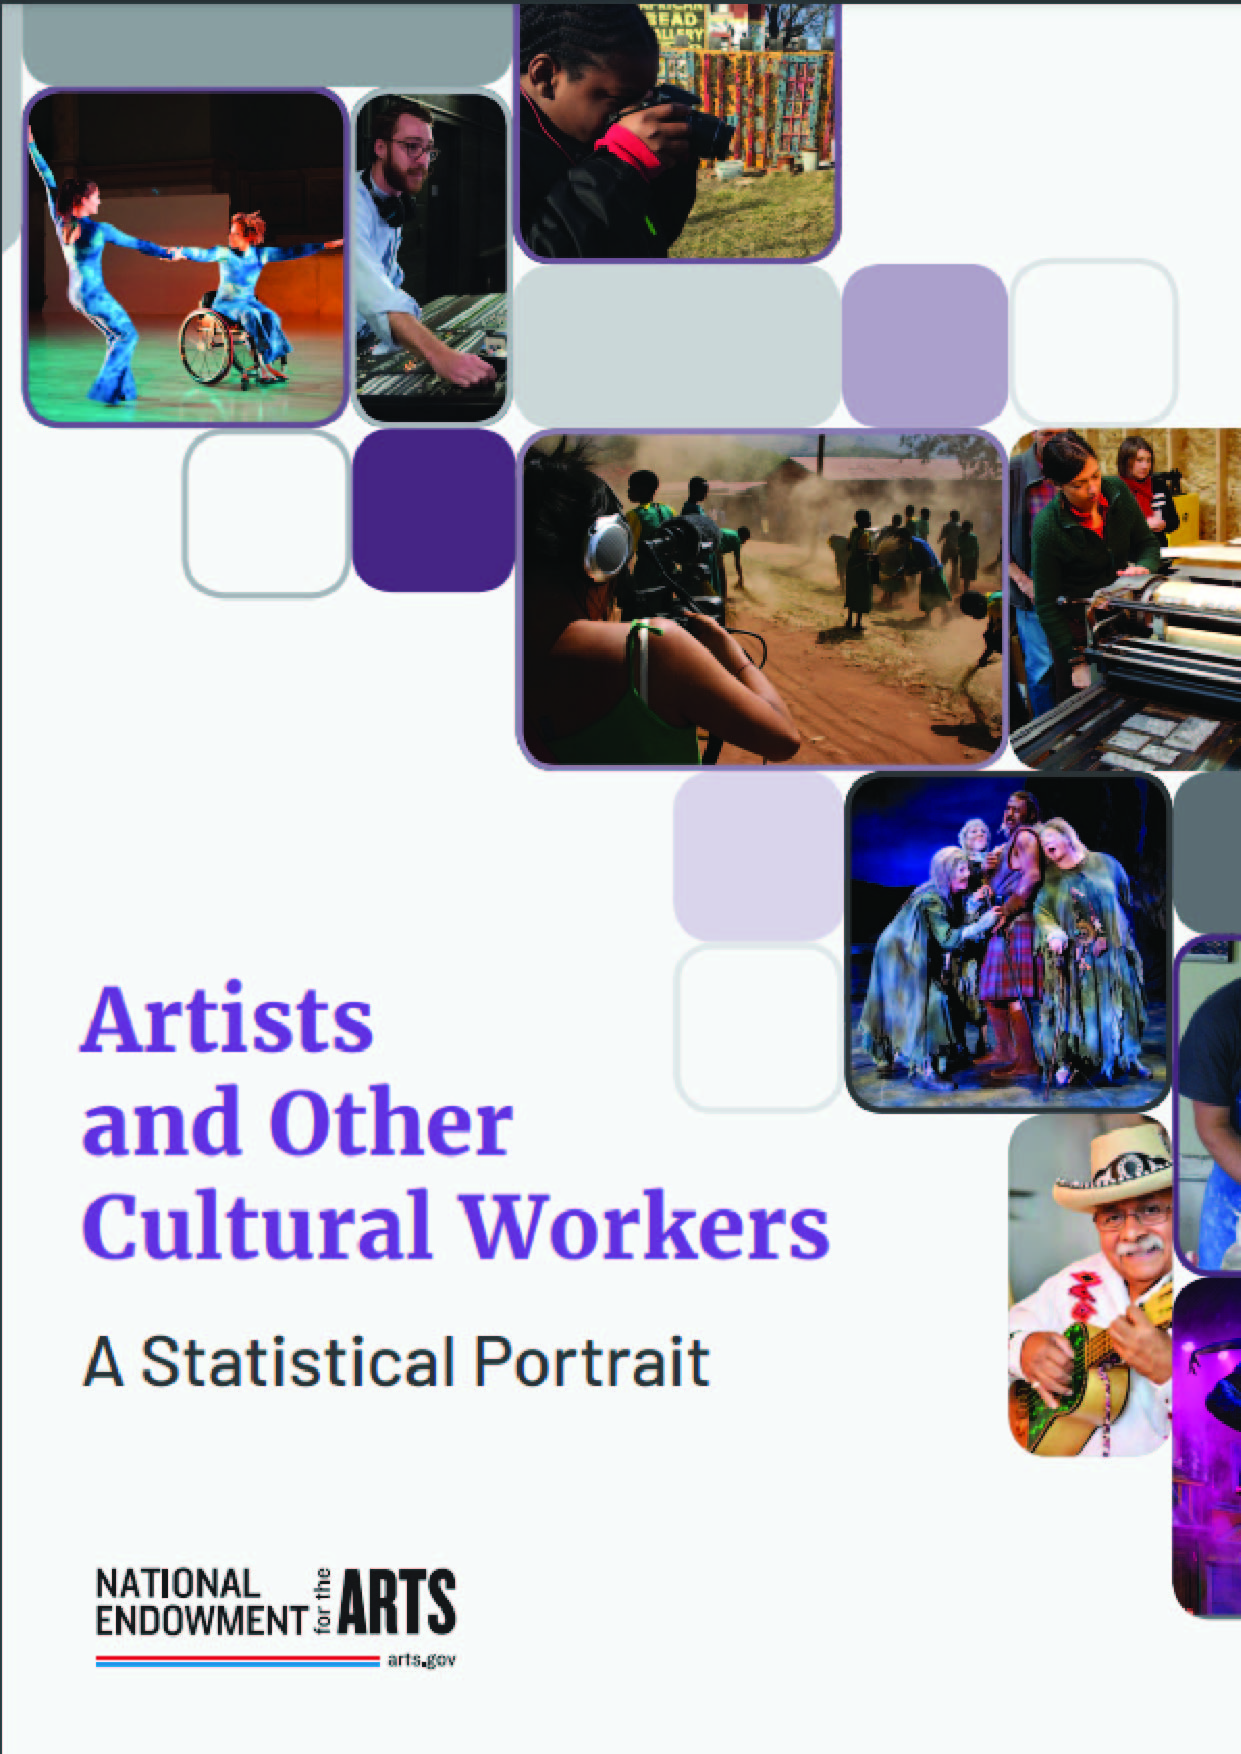
This omnibus report, Artists and Other Cultural Workers: A Statistical Portrait, extends the range of statistics that the National Endowment for the Arts historically has tracked as part of its decades-long research function. Although the agency periodically reports facts and figures about 11 distinct artist occupations (based on U.S. Census data), this report brings in other job characteristics, other data sources, and even other kinds of cultural workers. Among key findings are:
1. Regardless of occupation, over 5 million workers are employed in arts and cultural industries. They are all wage-and-salary workers.
- There are nearly 2.5 million artists in the U.S. labor force (either self-employed or wage-and-salary workers).
- Approximately 333,000 (self-employed or wage-and-salary) workers hold secondary jobs as artists.
- Another 1.2 million (self-employed or wage-and-salary) workers hold a primary job in a cultural occupation other than artist.
2. Artists are 3.6 times as likely as other workers to be self-employed.
- In 2012-2016, roughly 34 percent of all artists were self-employed. This compares with 9 percent of all workers.
- Most self-employed artists seem to like their work arrangement: 79 percent say they would not prefer to work for someone else, while 58 percent cite flexible schedules and independence as the main reasons they are self-employed.
3. Artists are becoming a larger share of the U.S. labor force.
- In 2006, artists composed 1.42 percent of the labor force; by 2017, they were 1.55 percent, representing a 6.1 percent increase.
- In 2017, the artist unemployment rate hit an 11-year low.
- As a group, artists currently experience unemployment rates similar to those of all U.S. workers.
4. Faster-than-average growth in employment is projected for set and exhibit designers, actors, producers and directors, and film and video editors.
- Between 2016 and 2026, annual job openings will have averaged 7,400 for actors and 14,100 for producers and directors. Employment growth in these occupations stems from strong demand for new movies and television shows.
- Employment of film/video editors is projected to grow at a 17 percent clip. A contributing factor is the number of shows increasingly produced by Internet-only sources and streaming services.
Chapter by chapter, this report builds a cohesive statistical summary of artists and other cultural workers in the United States. In doing so, it complements the National Endowment for the Arts’ regular measurements of two other key segments of the arts ecosystem: arts industries and organizations, and levels of arts participation nationwide.
Executive Summary
This report uses federal statistics from various sources to describe the artists and other cultural workers who participate in the U.S. labor market. Wherever possible, the most recently available data were analyzed. Number of Artists and Other Cultural Workers Regardless of occupation, over 5 million workers are employed in arts and cultural industries. They are all wage-and-salary workers.
- There are nearly 2.5 million artists in the U.S. labor force (either self-employed or wage-and-salary workers).
- Approximately 333,000 (self-employed or wage-and-salary) workers hold secondary jobs as artists.
- Another 1.2 million (self-employed or wage-and-salary) workers hold a primary job in a cultural occupation other than artist.
- •They are workers whose primary job is as an artist in one of the occupations listed below.
Number of workers who hold a secondary job as an artist:
- An estimated 333,000 workers hold secondary jobs as artists.
- More than half of these workers (56 percent) have a primary job in one of the following industries: healthcare and education; leisure and hospitality; and “professional” services, a category that includes advertising and photographic services.
- Relatively large shares of musicians, actors, and writers and editors are employed in these capacities as a second job.
Number of workers who hold a job in another cultural occupation:
- In addition to the 2.5 million workers whose primary job is as an artist, there are nearly 1.2 million workers whose primary job is in another cultural occupation.
- Librarians, editors, and printing press operators constitute the largest numbers.
- The number of archivists, curators, and museum technicians grew from 42,000 in 2006 to 61,000 in 2017—a gain of 45 percent.
- The job of processing photographs is a declining occupation. Between 2006 and 2017, the labor market shed 33,000 workers in that category.
Total number and trends of workers employed in arts and cultural industries:
- Regardless of their occupation, over 5 million workers are employed in arts and cultural industries.
- Although rising in recent years, the number of workers employed to produce arts and cultural goods and services is below the peak observed in 2001.
- In that year, arts and cultural employment reached 5.8 million, or 749,000 more workers than the arts economy employed in 2016, the most recent year for which data are reported.
- Artists are becoming a larger share of the U.S. labor force. ◦◦ In 2006, artists composed 1.42 percent of the labor force; by 2017, they were 1.55 percent, representing a 6.1 percent increase.
- In 2017, the artist unemployment rate hit an 11-year low.
- As a group, artists currently experience unemployment rates similar to those of all U.S. workers.
Want to know more about this book? Read through the book above now.


